
The Team Performance report gives Administrators and Team Leaders critical insights into their team's customer engagement and customer support efforts. Admins can view the data for their entire organization, while Team Leaders can only view the data of their teams.
Run this report in order to ensure smarter, faster, and more personal social support, while understanding how to save time and money on your team resources.
Note:
The Team Performance Report is only accessible to Social Media Management users with a user role of Admin or Team Leader.
Note:
Admin users have access to all Teams, but they are not counted as members of a Team unless working in its Team View. This means that Admins must work in the Team View in order for their actions in Engage to be counted in the Team Performance Report. Actions taken in Admin View will not be counted in any Team's reporting.
Creating a Team Performance report
- In Engage, click on Report overview in the left-hand navigation sidebar.
- Click Create Report in the top-right corner of the screen, then under Team Performance on the following screen, select Choose Report.
-
-
Once you are in the report, use the top bar to filter for the following criteria:
- Network (Facebook, X (Twitter), YouTube, Instagram, LinkedIn, WhatsApp, or TikTok)
- Post (i.e. a post created by a customer; does not include the brand's own posts)
- Comment (i.e. a comment created under a post)
Note:
Mentions on Facebook and Instagram will fall under the Post or Comment definition (depending on if the mention was part of a post or comment), with the exception of mentions on Instagram stories: these will be counted as DMs
- Reply (i.e. a reply to a comment)
- DM (i.e. a private direct message)
- Channels
- Teams
- Users
- Whole day or Within business hours
- Timeframe
Note:
Since customers cannot post to a brand's wall in TikTok, no TikTok posts will display in Team Performance reports. TikTok direct messages are not available in Team Performance reports due to limitations of the API.
Note:
Facebook Reviews reporting and Google Reviews reporting are currently not available in Team Performance reports.
-
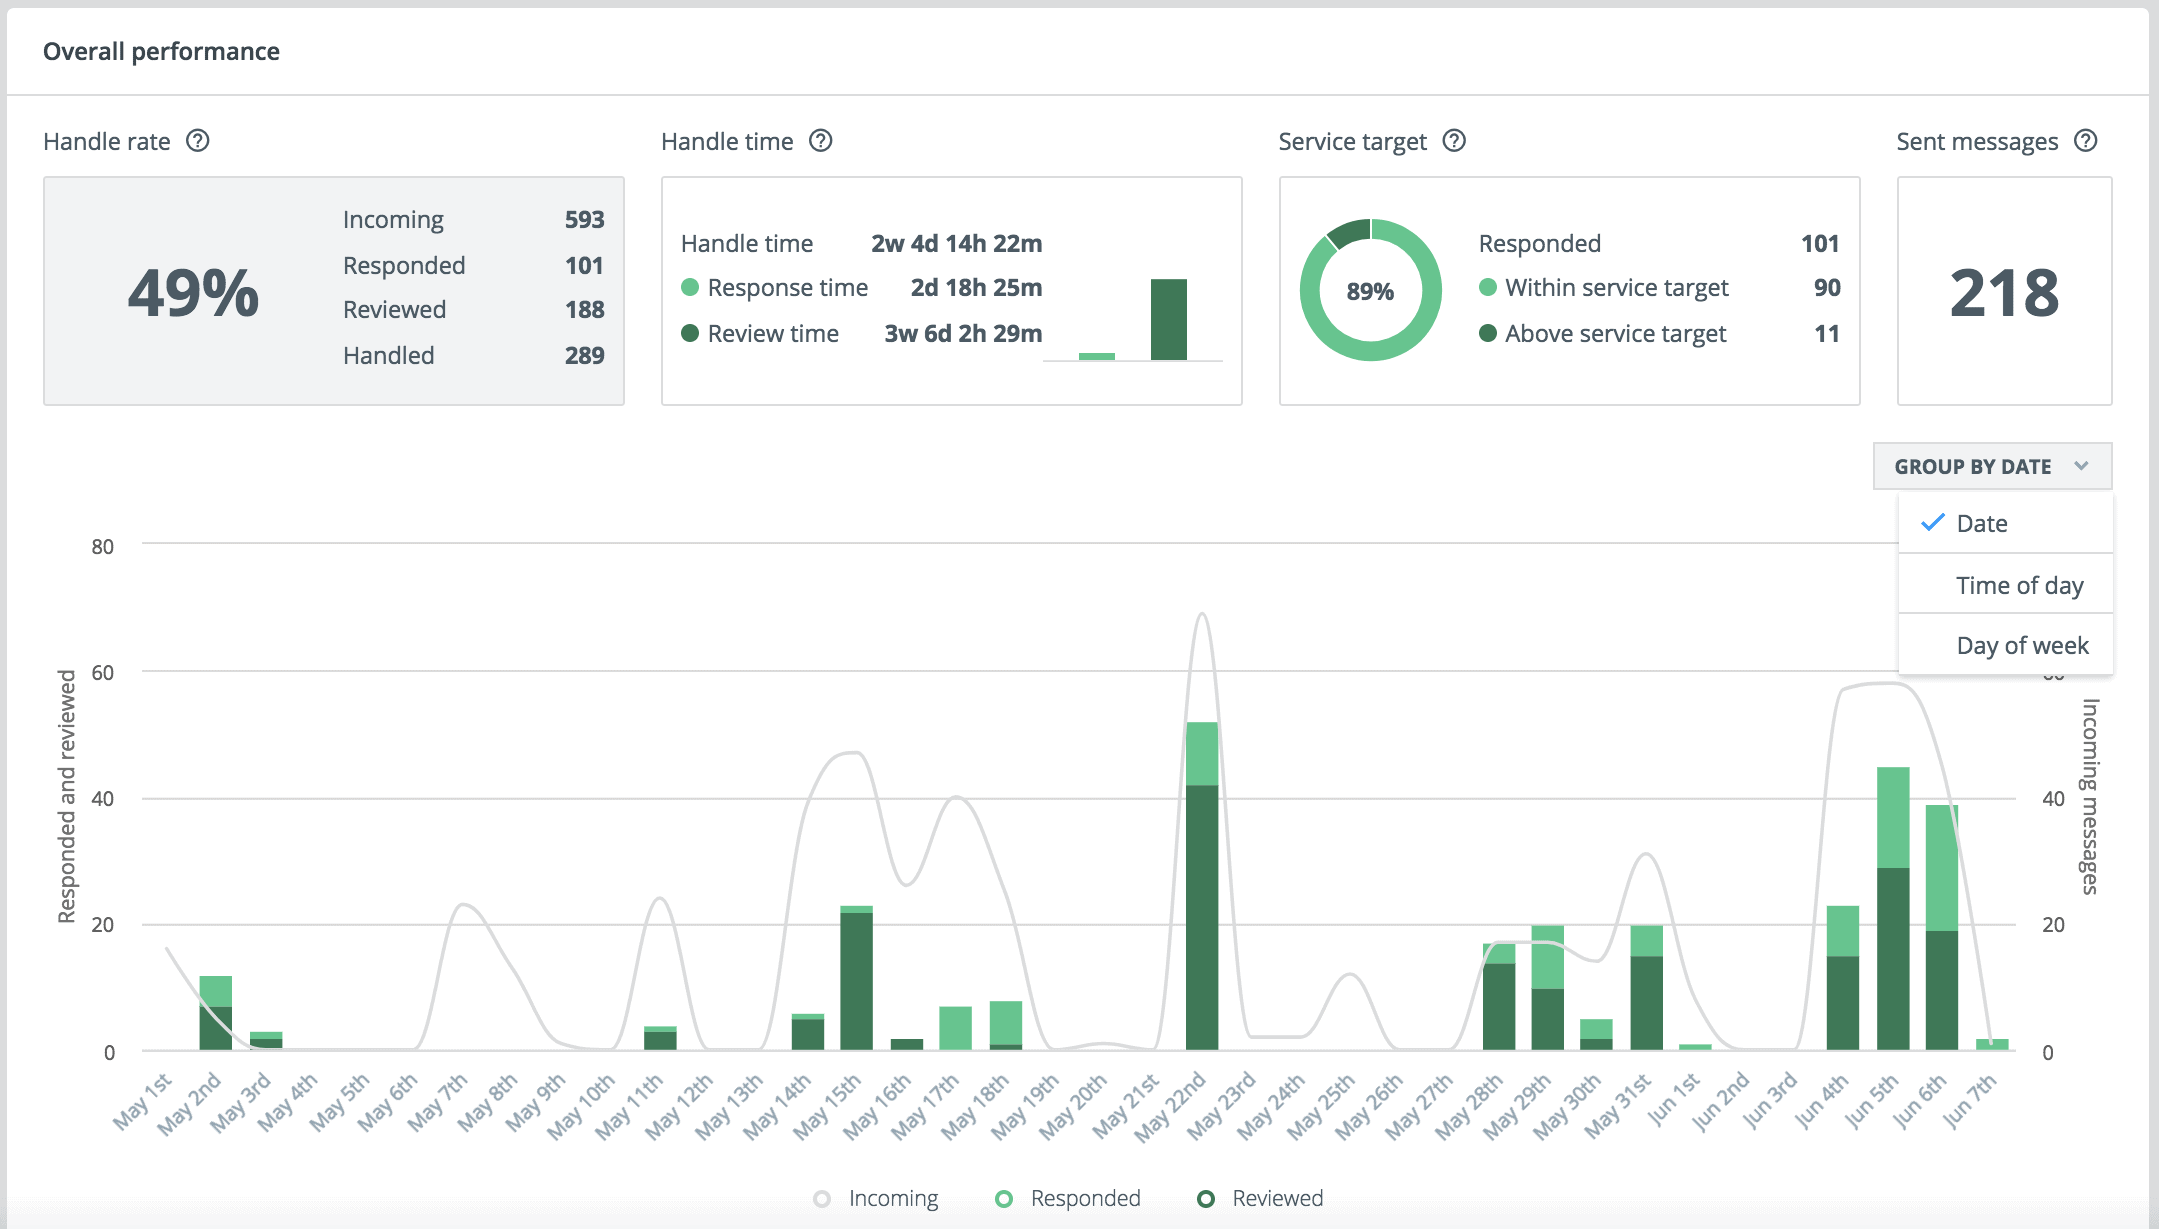
The Overall performance section provides you with a snapshot of the most important metrics so that the Admin or the Team lead is able to make quick adjustments.
- Handle rate
-
- Incoming
- Number of incoming messages sent by customers.
- Responded
- Number for messages that received a response.
- Reviewed
- Number of messages that were marked as read or deleted by moderators.
- Handled
- Sum of responded and marked as read or deleted.
- Handle rate
- Percentage of handled incoming messages.
- Handle time
-
- Handle time
- Time elapsed from the date when Social Media Management indexed a message to the date when the message was handled.
- Response time
- The average time elapsed from the date when Social Media Management indexed a message to the date when a response to the message was sent.
- Review time
- Time elapsed from the date when Social Media Management indexed a message to the date when this messages got marked as read or deleted. If message 1 got marked as read as a consequence of message 2 being marked as read or deleted, then Social Media Management counts two mark as read actions. Marking as read natively does not count towards marked as read in this report.
- Service target
-
- Responded
- Number of messages sent as a response to the oldest unhandled customer message.
- Within service target
- Number of responses sent within the service target.
- Above service target
- Number of responses where the response time was longer than the team service target.
- Sent messages
- The number of messages sent by Social Media Management users.
-
Click on the individual boxes under the Overall performance section, in order to view the metrics plotted on a timeline graph. You may adjust the exact metrics by selecting and deselecting them on the x-axis.
- The last section, User performance, shows and compares performance metrics for individual Social Media Management users. You may re-order the list according to which metric is most important to you by clicking on that metric.
- Name your report by clicking on the title in the upper left-hand corner and click Save to save your report.